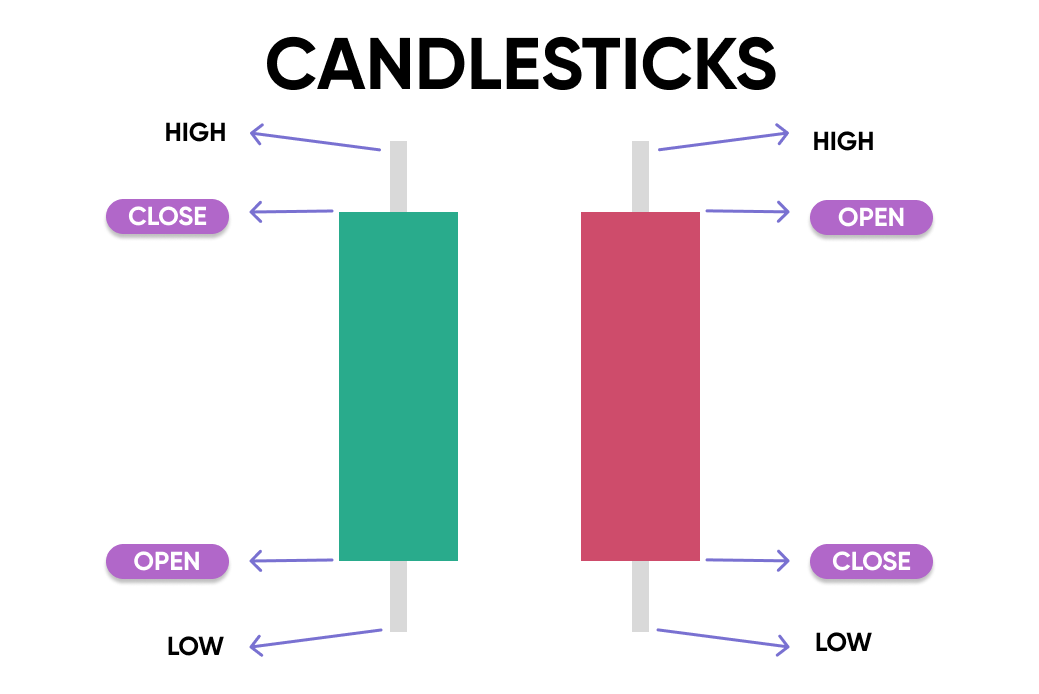
Candlesticks
Candlesticks carry information about opening and closing prices, highs and lows for a certain time interval. If an asset is rising, the candlestick is usually marked in green or clear (bullish move), and if it has fallen during the period, it is marked in red or full (bearish move). If the value of the cryptocurrency moved above or below the opening (closing) price, each candle will have an upper (lower) wick, as shown in the figure below.
Trend analysis is at the heart of the most successful trading strategies.
Price can only move in three different directions: up, down and sideways.
A sideways movement, also known as a "flat," is a period in which price does not show significant upward or downward fluctuations. It is usually the most difficult price movement to profit from.
When the price of a cryptocurrency is rising or falling, the trend is also moving up or down. It is at this stage that traders have the most profitable opportunities.
The following tools and methods can be used to determine the trend:
- Top and bottom - the highs and lows of price fluctuations over a certain period. An uptrend consists of higher highs and higher lows. A downtrend consists of lower lows and lower highs.
- Moving averages. A moving average moving upwards indicates that the price is in an uptrend, while its slope downwards indicates a downtrend. They show the average price over a certain period and can be set to identify long-term, short-term or intermediate trends.
- Determining trend lines. This is done by connecting price lows or highs. You need at least 2 points to check the trend line. The angle of the trend line determines its direction.
Chart
For years, successful traders and investors have used charts to achieve their material goals. In the past, they were used primarily for stocks, forex, and commodities; however, these same patterns are now evident in cryptocurrency charts as well.
The idea is that market sentiment depends on people's behavior - the decisions they make to buy or sell. You can't rely entirely on charts. However, they can be used as part of an overall trading plan to achieve your goals.
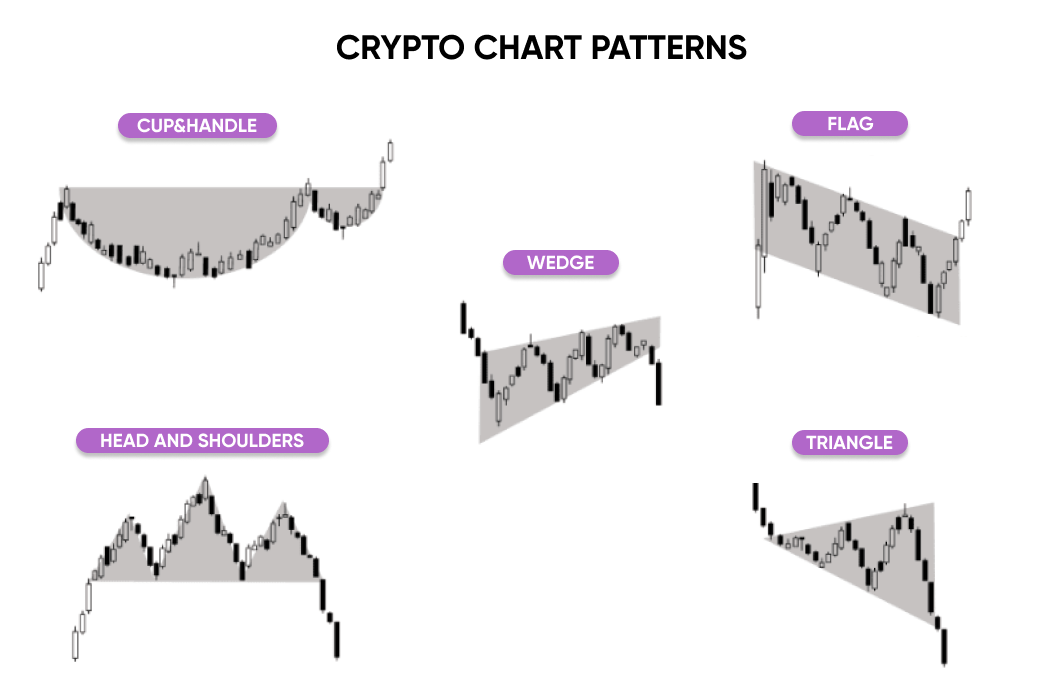
Some of the most popular patterns are:
- Cup & Handle represent collective market psychology. The "handle" occurs due to investors who bought the previous high. These people immediately lost money on their investment and are excited to simply break even. The rising price at the end of the handle signals to prospective traders that the sellers have exhausted themselves, and that there is still enough buying pressure to break through to a new high.
- Triangles are created with one horizontal trend line connecting highs or lows and a second sloped trend line connecting rising highs or falling lows.
- Head and shoulders is a slightly more advanced chart pattern that's characterized by a temporary high or low, followed by an even bigger move higher or lower, followed by a third move higher or lower that's equal to the first move.
- Wedges are similar to ascending and descending triangles, except both the upper and lower lines are sloped in the same direction (but are still converging). Unlike the ascending and descending triangle, rising and falling wedges are reversal patterns.
- Flags are expressed by small rectangular trading ranges within diagonal parallel lines for shorter periods of time. It moves against the dominant price trend over a longer time period.
The volume of trades made on the coin is shown at the bottom of the chart by bars, which are usually indicated in different colours. It is the palette that helps to determine the real supply and demand for a digital asset on a given trading floor.
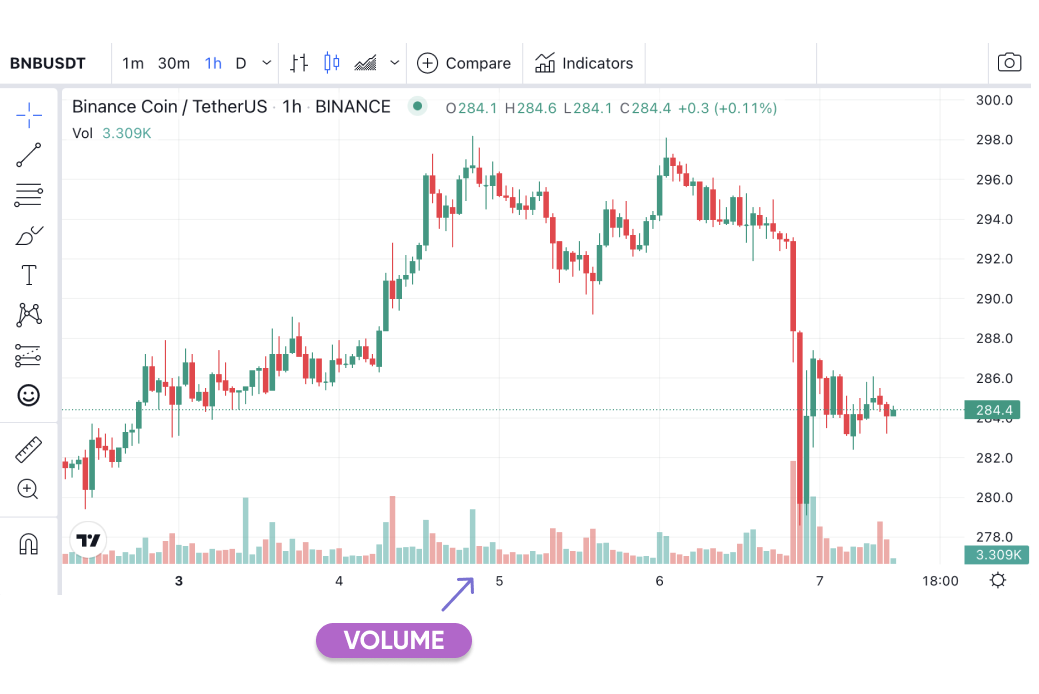
Often the price growth is accompanied by large buying volumes. That is, at this stage, many people are willing to buy the asset, which gives the trader more confidence about the further growth of the asset.
When the price of the cryptocurrency begins to fall, followed by volumes, it rather indicates that there is no significant selling pressure behind the movement. In most cases, such a pullback turns out to be consolidation rather than the beginning of a significant downtrend.
Time Frame
The time frame plays an important role because determining the interval is one of the main parameters for choosing a trading/investment strategy.
First, we advise you to learn how to read the monthly and weekly charts, which will help you determine the long-term trend. Then the daily and hourly charts. And only after that can you move on to smaller scales. The minute charts are usually used for speculative trading to understand the most accurate opportunity to enter a position.
If you intend to engage in day trading, then you should pay attention to the shorter timeframes. Common choices for day traders include 5-minute, 15-minute, 1-hour and 4-hour charts.
If you are looking for long-term investment opportunities, you want to use monthly and weekly charts. Make sure the chart is appropriate for your trading style, as there's no point in sweating over a 5-minute chart if the average trading time frame is several months.
Conclusion
Reading a chart is no guarantee of determining future price movements with 100 per cent accuracy. Technical analysis is somewhat discretionary, so it is not uncommon for two traders looking at the same chart to come to different conclusions.