The potential behavior of cryptocurrencies depends on various factors, including investor sentiment, which can be evaluated using the Fear and Greed Index. This tool helps investors analyze the potential behavior of the market based on the moods of its participants. CNN Money introduced this index in 2012.
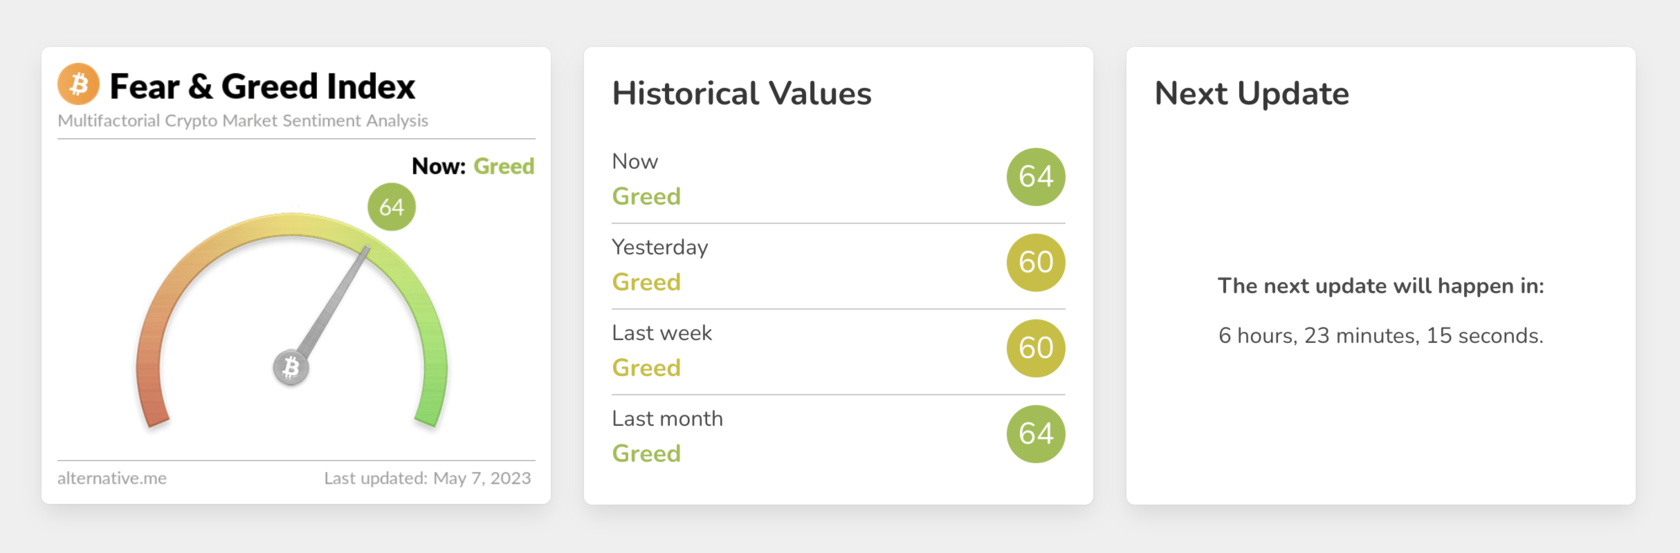
The Fear and Greed Index is a scale ranging from 0 to 100, where 0 represents maximum fear and 100 represents maximum greed. The midpoint at 50 indicates neutral market sentiment.
The original Fear and Greed Index was geared towards the stock market. However, Alternative.me has adapted it for cryptocurrencies. The Fear and Greed Index is updated every day, and its readings can be tracked via link.
What makes up the Fear and Greed Index?
The Fear and Greed Index analyzes several indicators, each of which occupies a certain percentage. Let's take a closer look at them:
25% - Volatility. This indicator reflects the average price of Bitcoin, the most capitalized cryptocurrency, for the past 30 and 90 days. The information helps to understand the level of certainty among market participants (whether there are active purchases, sales, or whether the market is standing still).
25% - Market momentum and volume data. The index compares Bitcoin trading volume and market activity for the past 30 and 90 days. The result helps to assess the activity of buyers and sellers to understand whether positive or negative sentiments prevail.
15% - Mentions of cryptocurrency on social media. The index uses hashtags on Twitter for analysis. An increase in mentions of cryptocurrency on social media indicates increased interest in coins, which often speaks to a rise in greed.
10% - Bitcoin dominance. An increase in this indicator indicates an inflow of new investors, as well as possible redistribution of funds in the market.
10% - Google Trends analysis results. Information on search queries that can be obtained through Google Trends also allows analyzing market participant sentiments. For example, an increase in the number of queries about crypto fraud can indicate a strengthening of fear in crypto.
15% - Survey results. According to the official website of the index authors, this parameter has temporarily ceased to be used when calculating the Fear and Greed Index.
How to read the Fear and Greed Index?
To understand the index, let's connect the logic: the greater the fear regarding crypto, the fewer buyers, as investors rarely buy assets in which they doubt. At the same time, extreme values of the Fear and Greed Index can be an indicator of a good entry point into the market for long-term investors.
Maximum greed can be a harbinger of overbought cryptocurrency market. At such moments, there is a risk of seeing a drop in prices.
Here is the standard rating scale for evaluating the Fear and Greed Index:
0–24: Extreme Fear. Color - orange.
25–49: Fear. Color - yellow.
50–74: Greed. Color - light green.
75–100: Extreme Greed. Color - green.
Seeing how the signals of the index work helps to overlay it on the Bitcoin chart. Peak BTC values usually come at maximum greed, while lows come at extreme fear.

The Fear and Greed Index should be supported by signals from other indicators and technical analysis. The tool is only an addition that helps to understand the general mood of market participants.